Project 3 PMC/NLC altitude, frequency and brightness changes related to changes in dynamics and chemical composition
From CAWSES
- Project leaders: G.Thomas (USA), U.Berger (Germany)
- Project members: S. Bailey (USA),M. DeLand (USA), J. Fiedler (Germany),B. Karlsson (Sweden), S. Kirkwood (Sweden), A. Klekociuk (Australia), F.-J. Lübken (Gemany), A. Merkel (USA), N. Pertsev (Russia), J. Russell III (USA), E. Shettle (USA)
Contents |
Introduction
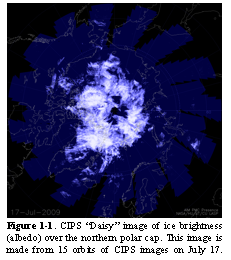
The 20-yr old speculation that high-altitude summertime ice clouds (polar mesospheric clouds or noctilucent clouds, here denoted MC) are affected by anthropogenic activities has recently received support from a 30-year time series of SBUV (Solar Backscatter Ultraviolet) satellite measurements (see Figure 1). SBUV data reveal a significant trend in bright MC properties. However, the robustness of the trend, extracted from interannual, local-time and solar-cycle variability, and its underlying causes remains debatable. It is important to understand the relative roles of these three factors (solar, inter-annual and long-term forcing) before a definitive long-term trend can be evaluated. Furthermore the problem of attribution, that is, the nature of the various forcings on ice formation is not yet understood. For example with respect to the long-term changes, is a lowered temperature due to higher carbon dioxide responsible for the observed increase in brightness and occurrence frequency of MC? Or are water vapor changes due to oxidation of methane responsible, since we know that lower atmospheric methane has more than doubled over the past 120 years, and methane oxidation leads to upper atmospheric water vapor. The failure to detect any changes in the altitude of MC since the first measurement made by Otto Jesse in the late nineteenth century has provided an important constraint, since water vapor changes and temperature changes affect cloud altitude in different ways. Fortunately, the state of the art in modeling has now reached a point where ice formation is coupled with general circulation models. Recent results are reported in the references below:

References
- Luebken, F.-J., U. Berger, and G. Baumgarten (2009), Stratospheric and solar cycle effects on long-term variability of mesospheric ice clouds, J. Geophys. Res., 114, D00I06, doi:10.1029/2009JD012377
- Merkel, A. W., Marsh, D. R., Gettelman, A., and Jensen, E. J.: On the relationship of polar mesospheric cloud ice water content, particle radius and mesospheric temperature and its use in multi-dimensional models, Atmos. Chem. Phys., 9, 8889-8901, 2009
- Merkel, A. W., D. Marsh, G. E. Thomas, C. Bardeen, M. Deland, WACCM simulations of long-term changes in polar mesospheric clouds, Layered Phenomenon in Mesospheric Regions (LPMR) Conference, Stockholm, 2009
- Marsh, D and A. W. Merkel, 30-year PMC variability modeled by WACCM, SA33B-08, Fall AGU Meeting, San Francisco, 2009
- Shettle,E. P.,M. T. DeLand, G. E. Thomas, and J. J. Olivero (2009), Long term variations in the frequency of polar mesospheric clouds in the Northern Hemisphere from SBUV, Geophys. Res. Lett., 36, L02803, doi:10.1029/2008GL036048.
Workshops and Meetings
The first workshop under the auspices of this working group was held in Boulder, Colorado on December 10 & 11, 2010, entitled Modeling Trends in mesospheric clouds. A short meeting report will be published: Reference: December 2009 PMC Trend Meeting Report entitled Mesospheric ice clouds as indicators of upper atmosphere climate change, accepted by EOS, publication date April 2010
In addition, The 6th IAGA/ICMA/CAWSES workshop on “Long-Term Changes and Trends in the Atmosphere [1] will be held at National Center for Atmospheric Research (NCAR) Center Green Conference Center, Boulder, Colorado, USA, June15-18, 2010, the week before the 2010 CEDAR (Coupling, Energetics, and Dynamics of Atmospheric Regions) workshop [2], which will also be held in Boulder.
Observing Facilities
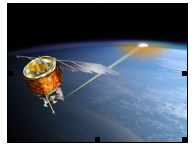
Aeronomy of Ice in the Mesosphere (AIM), a NASA satellite mission (2007-)
AIM was launched from Vandenberg Air Force Base on April 25, 2007 becoming the first satellite mission dedicated to the study of Polar Mesospheric Clouds (PMCs). A Pegasus XL rocket placed the AIM satellite into a near circular (601 km apogee, 595 km perigee), 12:00 AM/PM sun-synchronous orbit. By measuring PMCs and the thermal, chemical and dynamical environment in which they form, AIM will quantify the connection between these clouds and the meteorology of the polar mesosphere. In the end, this will provide the basis for study of long-term variability in mesospheric climate and its relationship to global change. The results of AIM will be a rigorous test and validation of predictive models that then can reliably use past PMC changes and current data to assess trends as indicators of global change. This goal is being achieved by measuring PMC densities, spatial distribution, particle size distributions, gravity wave activity, meteoric smoke influx to the atmosphere and vertical profiles of temperature, H2O, O3, CH4, NO, and CO2.The overall goal of AIM is to resolve why PMCs form and why they vary. It has been suggested that the observed changes in the clouds are related to increased concentrations of greenhouse gases. This suggestion is plausible because an increase in carbon dioxide, while warming the surface of the Earth, cools the upper atmosphere which can facilitate mesospheric cloud formation there. Additionally, increases in methane at the surface of the Earth lead to increases in water vapor at high altitudes through chemical oxidation processes, which further facilitates cloud formation and growth. While plausible, this greenhouse gas hypothesis has not yet been proven.The AIM webpage is at [3] --Gary.thomas 20:42, 1 April 2010 (UTC)
Arctic Lidar Observatory for Middle Atmosphere Research (ALOMAR)
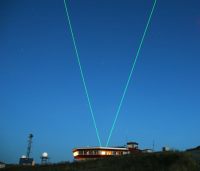
The Rayleigh/Mie/Raman (RMR) lidar at the Arctic Lidar Observatory for Middle Atmosphere Research (ALOMAR) is located on top of a ≈400 m high mountain in Northern Norway (69.3°N, 16.0°E). It was installed in 1994 and designed for multi-parameter investigations of the Arctic middle atmosphere on a climatological basis. Because of its Arctic location, the lidar is optimized for measurements during full sunlight. Appropriate technical solutions, laser wavelength stabilization in combination with strong spectral as well as spatial filtering at the receiving system, have been implemented. The lidar is a complex twin-system consisting of two power lasers, two receiving telescopes, and one optical bench for spectral separation and filtering of the light received from the atmosphere. The lasers emit pulses at three wavelengths (355 nm, 532 nm, 1064 nm) simultaneously with an overall peak power of 150 MW per laser. The backscattered light from the atmosphere is collected by telescopes with a diameter of 1.8 m each. They can be tilted up to 30° off-zenith to allow different viewing directions (Fig. 1), which separates the sounding volume up to 90 km at an altitude of 80 km. After spectral and intensity separation the light is analyzed by 15 channels and recorded by single photon counting detectors. One main objective of the RMR-lidar is the observation of ice layers in the mesopause region, which are known as noctilucent clouds (NLC) and polar mesospheric clouds (PMC). Throughout the NLC season (1 June to 15 August) the lidar is operational for 24 hours per day to measure whenever permitted by the local weather conditions. This yielded a total of more than 4000 measurement hours from 1997 to 2009. NLC were observed during ≈1700 hours which is the largest NLC data base acquired by lidar. The data are used to investigate decadal scale changes of NLC parameters, size and number density of the ice particles, as well as small scale structures which are often observed in the cloud layers. Fig. 2 shows the time series of NLC occurrence and altitude above ALOMAR covering one solar cycle (taken from reference 2). During these 11 years there is no statistical significant anti-correlation between cloud occurrence and solar activity, which is partly in contrast to other data sets. The mean cloud altitude is 83.2 km and appears to remain nearly unchanged since the first NLC observations more than 100 years ago.


